
Denver Metro Market in a Minute
(May 2026)
Thinking about selling your home in the Denver Metro area? Understanding the current market trends is crucial for making informed decisions. Our comprehensive market report spans the seven-county area, including Adams, Arapahoe, Boulder, Broomfield, Denver, Douglas, and Jefferson Counties.
Key Insights into the Denver Metro Real Estate Market:
- Average Sales Price: Stay informed about the latest average sales prices to position your home competitively.
- Number of Homes Sold: Gain insights into the volume of transactions and what it means for your selling strategy.
- Days on Market: Understand how quickly homes are selling to better time your listing.
Our detailed report offers everything you need to know about the local real estate trends. For a personalized analysis of your home or neighborhood, don't hesitate to reach out.
Stay ahead in the Denver Metro real estate market with our expert insights!
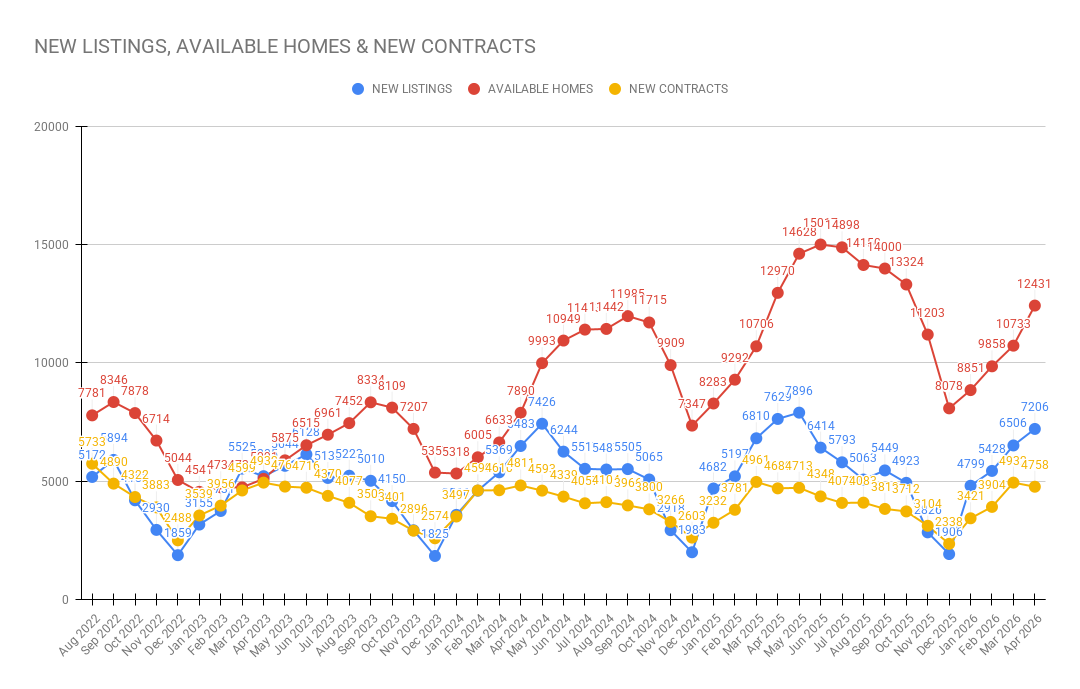
7206
New Listings
12431
Active Listings
4758
Under Contract
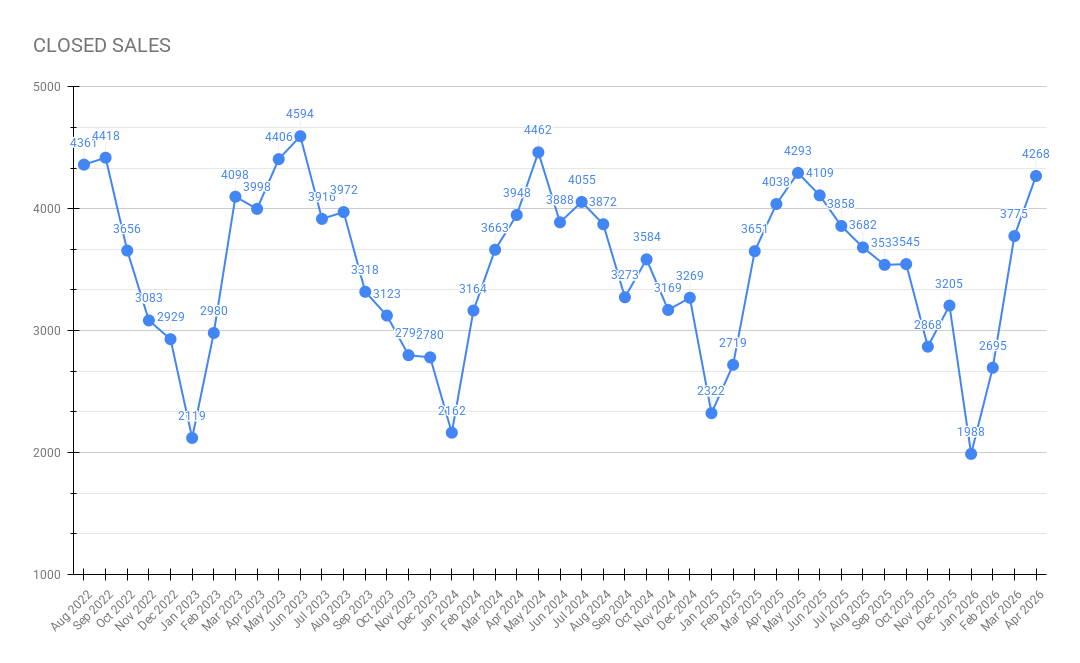
4268
Closed Sales
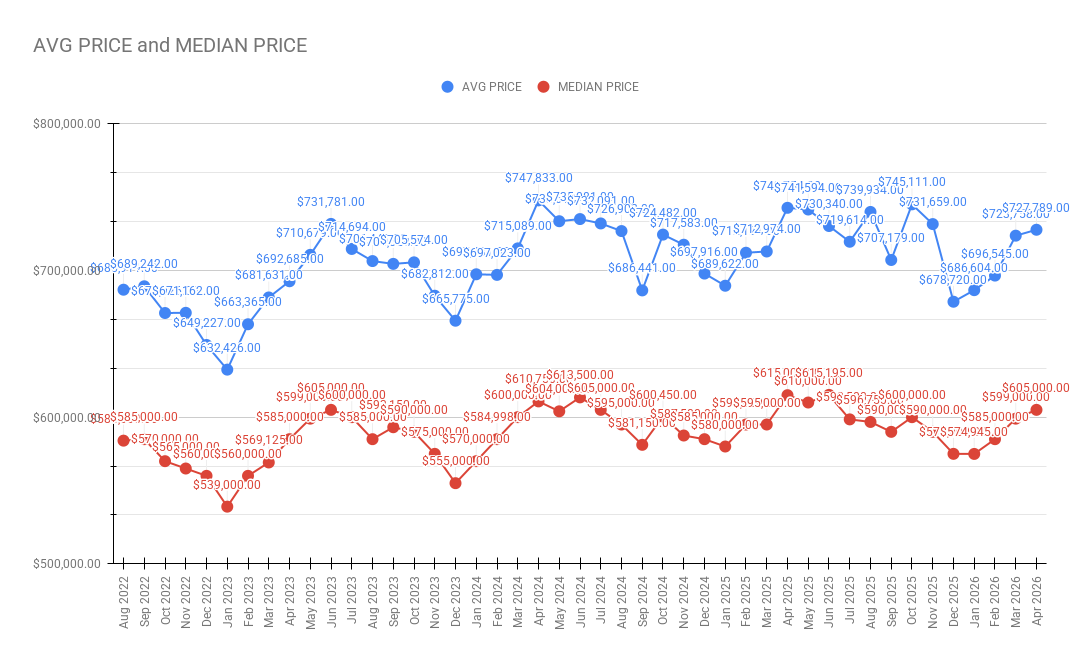
 $727,789
Average Sold Price
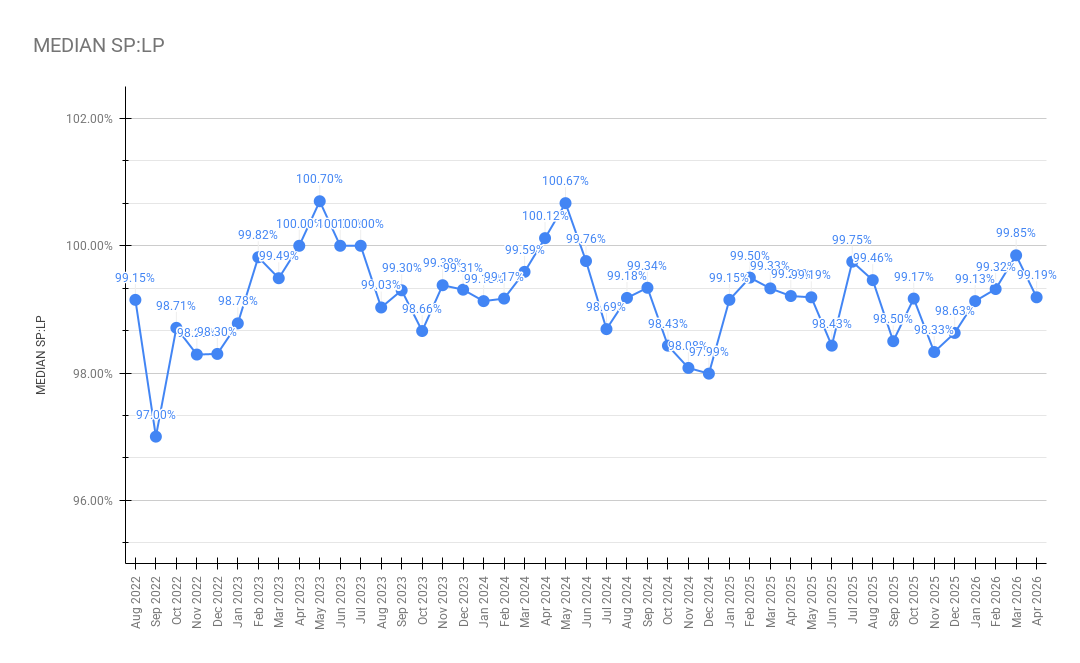
 99.19%
Sale-to- List Price Ratio
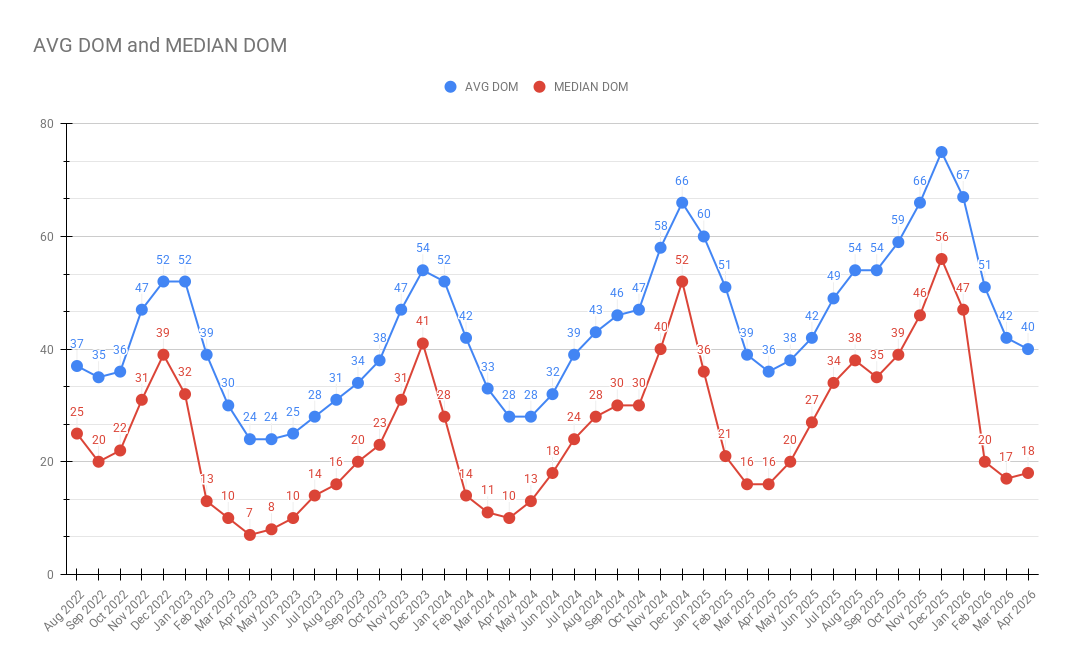
 40
40
Average Days on Market
 18
18
Median Days on Market
What does this mean for you?
In real estate, timing is everything. That’s why we analyze 9 key metrics every month to determine whether the market is shifting toward a seller’s market or a buyer’s market.
By comparing these metrics month-over-month, we uncover the latest trends, and by looking at them year-over-year, we gain valuable insights into the bigger picture. This approach helps us—and you—decide whether it’s the right time to buy, sell, or stay put, depending on your goals.
Stay informed and make confident decisions with our Market in a Minute update below:
📅 Month-over-Month: April 2026 vs March 2026
Trending Toward a Seller’s Market:
- Closed Sales 📈 13.1% (3 straight)
- Average DOM 📉 4.8% (4 straight)
- Median Price 📈 1.0% (3 straight)
- Average Price 📈 0.6% (4 straight)
Trending Toward a Buyer’s Market:
- Available Homes 📈 15.8% (4 straight)
- New Listings 📈 10.8% (4 straight)
- Median DOM 📈 5.9%
- New Contracts 📉 3.5%
- SP:LP Ratio 📉 0.7%
📅 Year-over-Year: April 2026 vs April 2025
Trending Toward a Seller’s Market:
- Closed Sales 📈 5.7%
- New Contracts 📈 1.5%
- Available Homes 📉 4.2%
- New Listings 📉 5.5%
Trending Toward a Buyer’s Market:
- Median DOM 📈 12.5%
- Average DOM 📈 11.1%
- Average Price 📉 2.0%
- Median Price 📉 1.6%
- SP:LP Ratio 📉 0.02%
What Does This Mean for You?
These are macro comparisons for a seven-county region, but many micro markets have dramatically different trends. Want to know what’s happening in your neighborhood?
👉 Get Your Free Home Value Report Here