
Lakewood Ranch Market in a Minute
(May 2026)
Planning to sell your home in the Lakewood Ranch area? Staying informed about the latest market trends is essential for a successful sale.
Key Insights into the Lakewood Ranch Real Estate Market:
- Average Sales Price: Discover the current average sales prices to strategically price your home.
- Number of Homes Sold: Understand the transaction volume and its implications for your selling plans.
- Days on Market: Learn how quickly homes are moving to optimize your listing timing.
Our detailed market report provides all the essential information you need about local real estate trends. For a tailored analysis of your specific area, feel free to reach out to us.
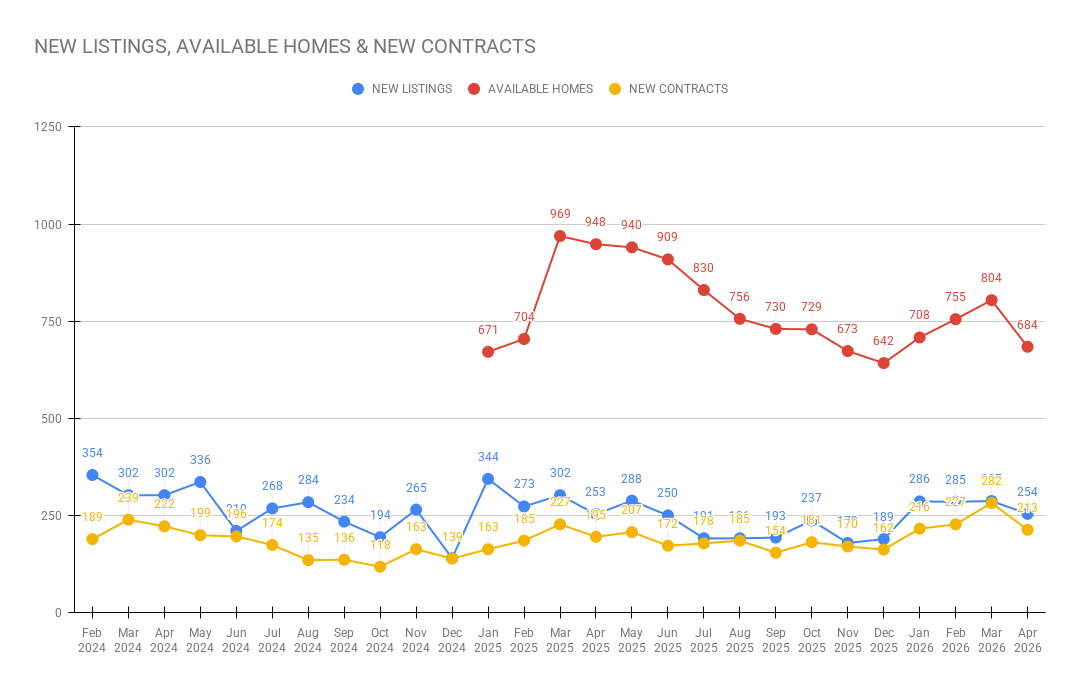
254
New Listings
684
Active Listings
213
Under Contract
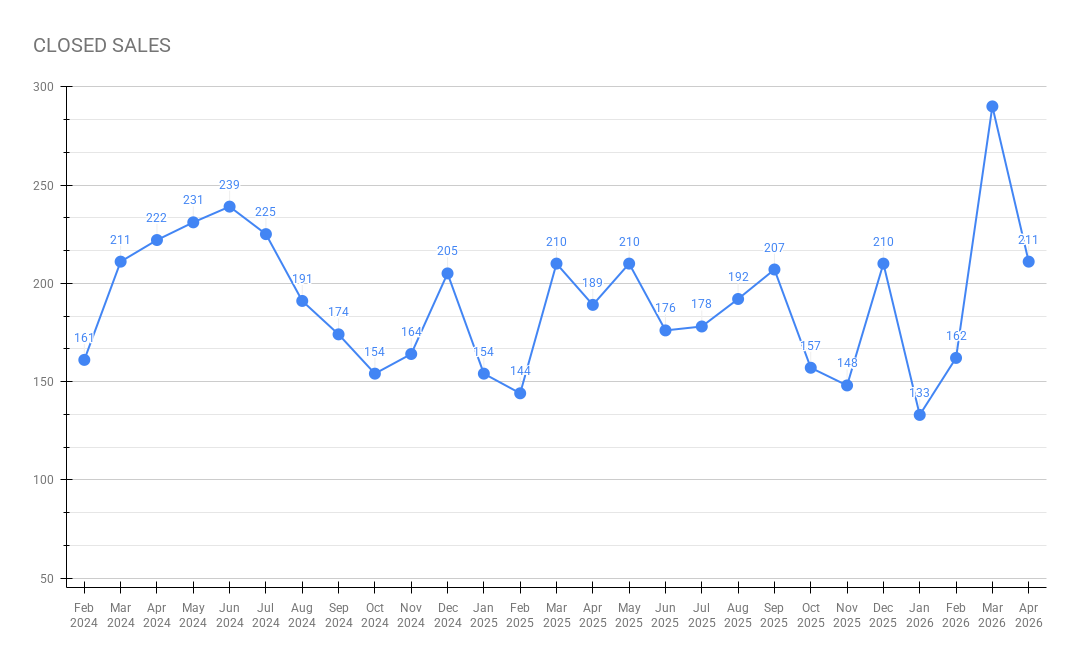
211
Closed Sales
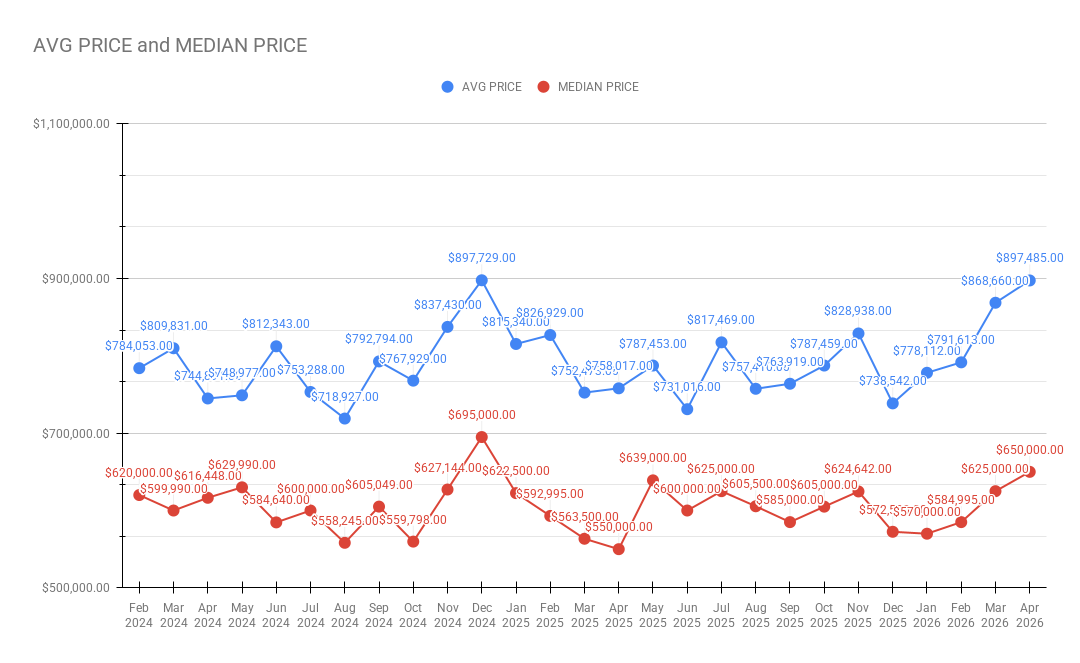
 $897,485
Average Sold Price
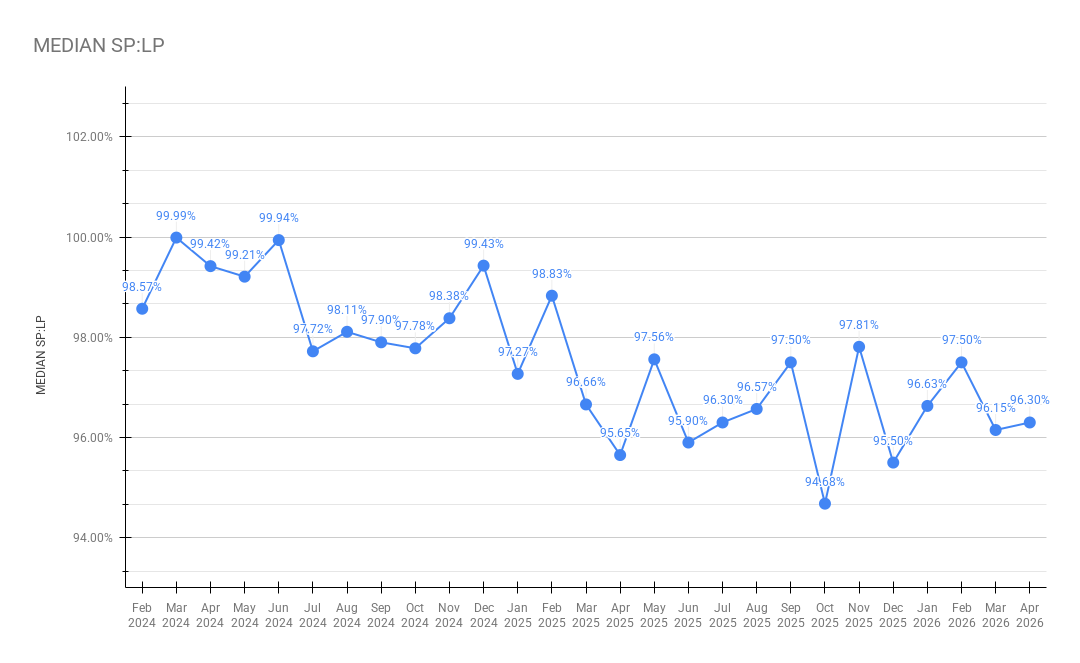
 96.3%
96.3%
Sale-to-List Price Ratio
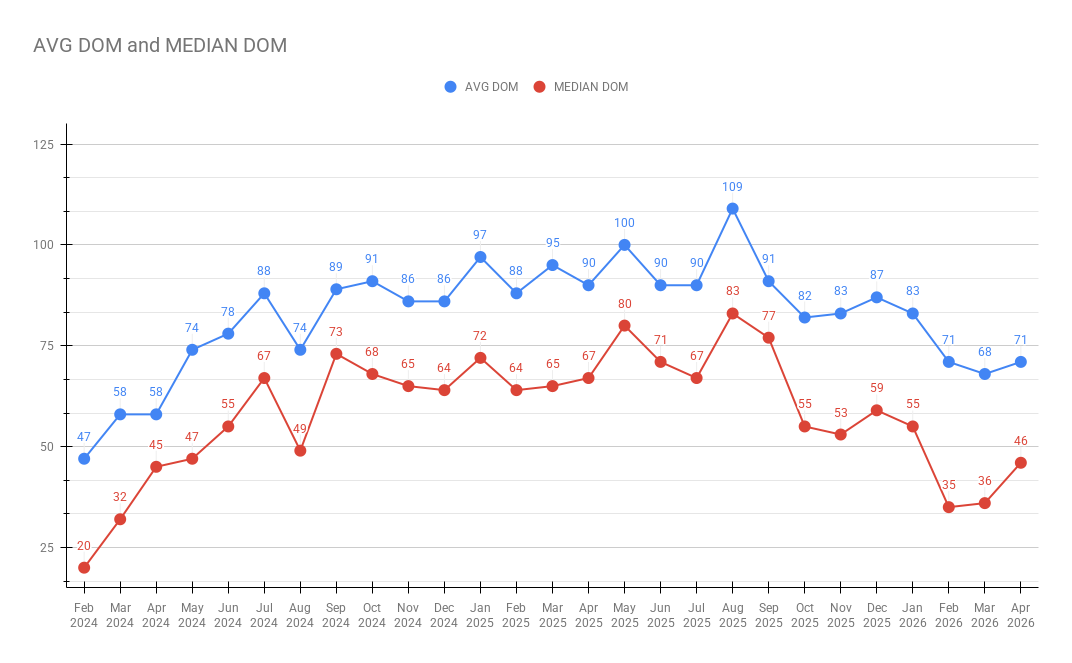
 71
71
Average Days on Market
 46
46
Median Days on Market
What does this mean for you?
In real estate, timing is everything. That’s why we analyze 9 key metrics every month to determine whether the market is shifting toward a seller’s market or a buyer’s market.
By comparing these metrics month-over-month, we uncover the latest trends, and by looking at them year-over-year, we gain valuable insights into the bigger picture. This approach helps us—and you—decide whether it’s the right time to buy, sell, or stay put, depending on your goals.
Stay informed and make confident decisions with our Market in a Minute update below:
📅 Month-over-Month: April 2026 vs March 2026
Trending Toward a Seller’s Market:
- Average Price 📈 3.3% (4 straight)
- Median Price 📈 4.0% (3 straight)
- SP:LP Ratio 📈 0.2%
- New Listings 📉 11.5%
- Available Homes 📉 14.9%
Trending Toward a Buyer’s Market:
- Median DOM 📈 27.8% (2 straight)
- Average DOM 📈 4.4%
- New Contracts 📉 24.5%
- Closed Sales 📉 27.2%
📅 Year-over-Year: April 2026 vs April 2025
Trending Toward a Seller’s Market:
- Median DOM 📉 31.3%
- Available Homes 📉 27.8%
- Average DOM 📉 21.1%
- Average Price 📈 18.4%
- Median Price 📈 18.2%
- Closed Sales 📈 11.6%
- New Contracts 📈 9.2%
- SP:LP Ratio 📈 0.7%
Trending Toward a Buyer’s Market:
- New Listings 📈 0.4%
What Does This Mean for You?
These are macro comparisons for the city, but many micro markets have dramatically different trends. Want to know what’s happening in your neighborhood?
👉 Get Your Free Home Value Report Here