


Tampa Market Report for November 2015

Sean Ready
Sean Ready – Florida and Colorado Realtor | Innovative Solutions, Proven Results Sean and his team specialize in creating certainty before clients e...
Sean Ready – Florida and Colorado Realtor | Innovative Solutions, Proven Results Sean and his team specialize in creating certainty before clients e...
Welcome to the latest edition of the Tampa Market Report for November 2015. One of my favorite parts of what I do is analyzing and interpreting the latest market data. My passion is to take these data, such number of home sales, change in pricing, months' of inventory, sale price to list price ratios, average days on market, etc. and turn it into a simplistic and insightful view on today's real estate market that you can use to your benefit!
Let's start with a summary of the most recent data put out by the Greater Tampa Association of Realtors;
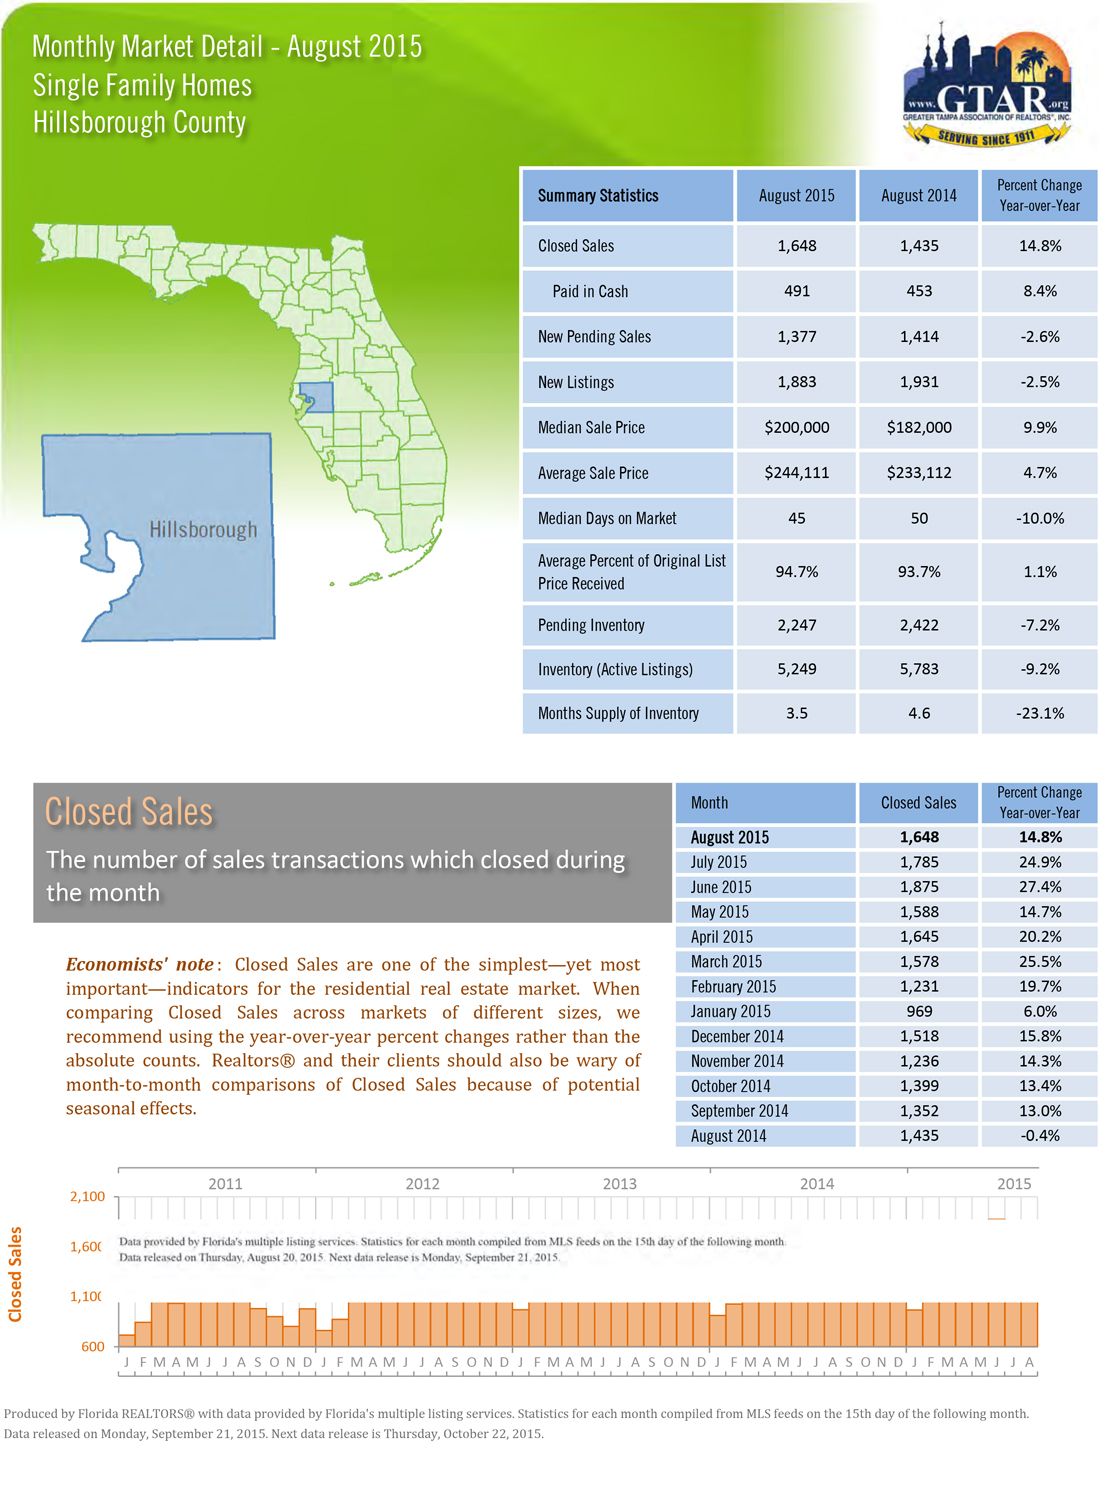
You may notice that the image states that these are the numbers from August...there's a lag in GTAR's reporting, so we're working with the most recent summary we have. We can always work up more up-to-the-minute numbers for you specifically!
THE GOOD:
Closed sales: The number of closed sales has been up year-over-year for seven of the eight months reported so far in 2015. It's been a banner year for sales in Tampa, with a little indication of a slow down covered later.
Home values: We're back up into the $200's for both the average AND the median sale price for the first time in nearly a decade! With strong sales and limited inventory, prices have been on a steady incline since the market's bottom in 2010. The median sale price is up nearly 10% since last year!
Days on Market: Although it's a small decline of 5 days, the average time a home spends on the market for sale is down from last year. It now takes just a month and a half to sell a home, on average. Unless the market is heavily appreciating (like 20% or more per year), your chances for selling for the highest price continues to be in the first few weeks of listing your home for sale.
THE BAD:
Inventory levels: Well, this could be filed under "the good" depending which side of the market you're on (buyer or seller). The number of homes on the market is down over 9% from last year. The number of new listings to hit the market in August is down slightly from last year too.
Month's supply: Again this could be good if you're selling, not so much if you're a buyer. Right now there's only 3.5 months' worth of supply out there. This means that it would only take three and a half months to sell everything that's currently for sale, given the current sale pace. Last year there was a full month's worth more for sale.
THE UGLY:
Pending sales: An indication of closings within the next few months is the number of new contracts, which is down 2.6% since last year. This means we could see a slower fourth quarter than 2014 in terms of home sale. It could be a market slowdown, and can also be a side product of the lack of homes to buy.
New Listings: Piggy backing on that is the number of newly available homes. Down 2.5% from last year, the already low inventory levels show no signs of breaking. Today's buyers have even less to choose from than in 2014.
WHAT IT ALL MEANS:
As we wrap up a huge year for home sales, the market continues its huge rise from the depths of the recession. Prices have come back to near 2004-2005 levels, after falling 40-60% in some areas of Tampa Bay. Inventory levels are a fourth of their 2010 levels, when short sales and foreclosures ran rampant. If you're a buyer, you undoubtedly feel the competitiveness of searching for homes. If you're a seller, you're likely having discussions with your agent of how to handle multiple offers and creating bidding wars.
Going into the end of the year, we typically see a big push of closings from those who want to reap the tax benefits of the homestead exemption. In fact, December is often in the top five months in terms of number of closings in most years. Many would be sellers make the common mistake of waiting until after the holidays to list their home. There are a few reasons why this may not be in your best interest:
- Seasonality discussed. December is a huge closing month. Why not take advantage of the buyers who would pay a premium to close this year? January-March are traditionally the slowest months for closings.
- Show-ability. How great does your home look during the holidays?
- Down time. When do buyers have the most time off to look at homes? During the holidays!
- Competition. If everyone waits until after the holidays to list their home, how many more competitors will you have?
- The unknown. What will the post holiday market look like? Will interest rates go up? Will the election year have a negative effect on the market? Will international factors play a role? We know what today's market looks like!
We hope you find this information helpful for your individual real estate needs, and encourage you to call or click for a free comprehensive market analysis on your home or home search. Thanks for reading!