


The 2016 Real Estate Market Report

Sean Ready
Sean Ready – Florida and Colorado Realtor | Innovative Solutions, Proven Results Sean and his team specialize in creating certainty before clients e...
Sean Ready – Florida and Colorado Realtor | Innovative Solutions, Proven Results Sean and his team specialize in creating certainty before clients e...
Welcome to the latest edition of the Tampa Market Report for January 2016. One of my favorite parts of what I do is analyzing and interpreting the latest market data. My passion is to take these data, such number of home sales, change in pricing, months' of inventory, sale price to list price ratios, average days on market, etc. and turn it into a simplistic and insightful view on today's real estate market that you can use to your benefit!
Let's start with a summary of the most recent data put out by the Greater Tampa Association of Realtors;
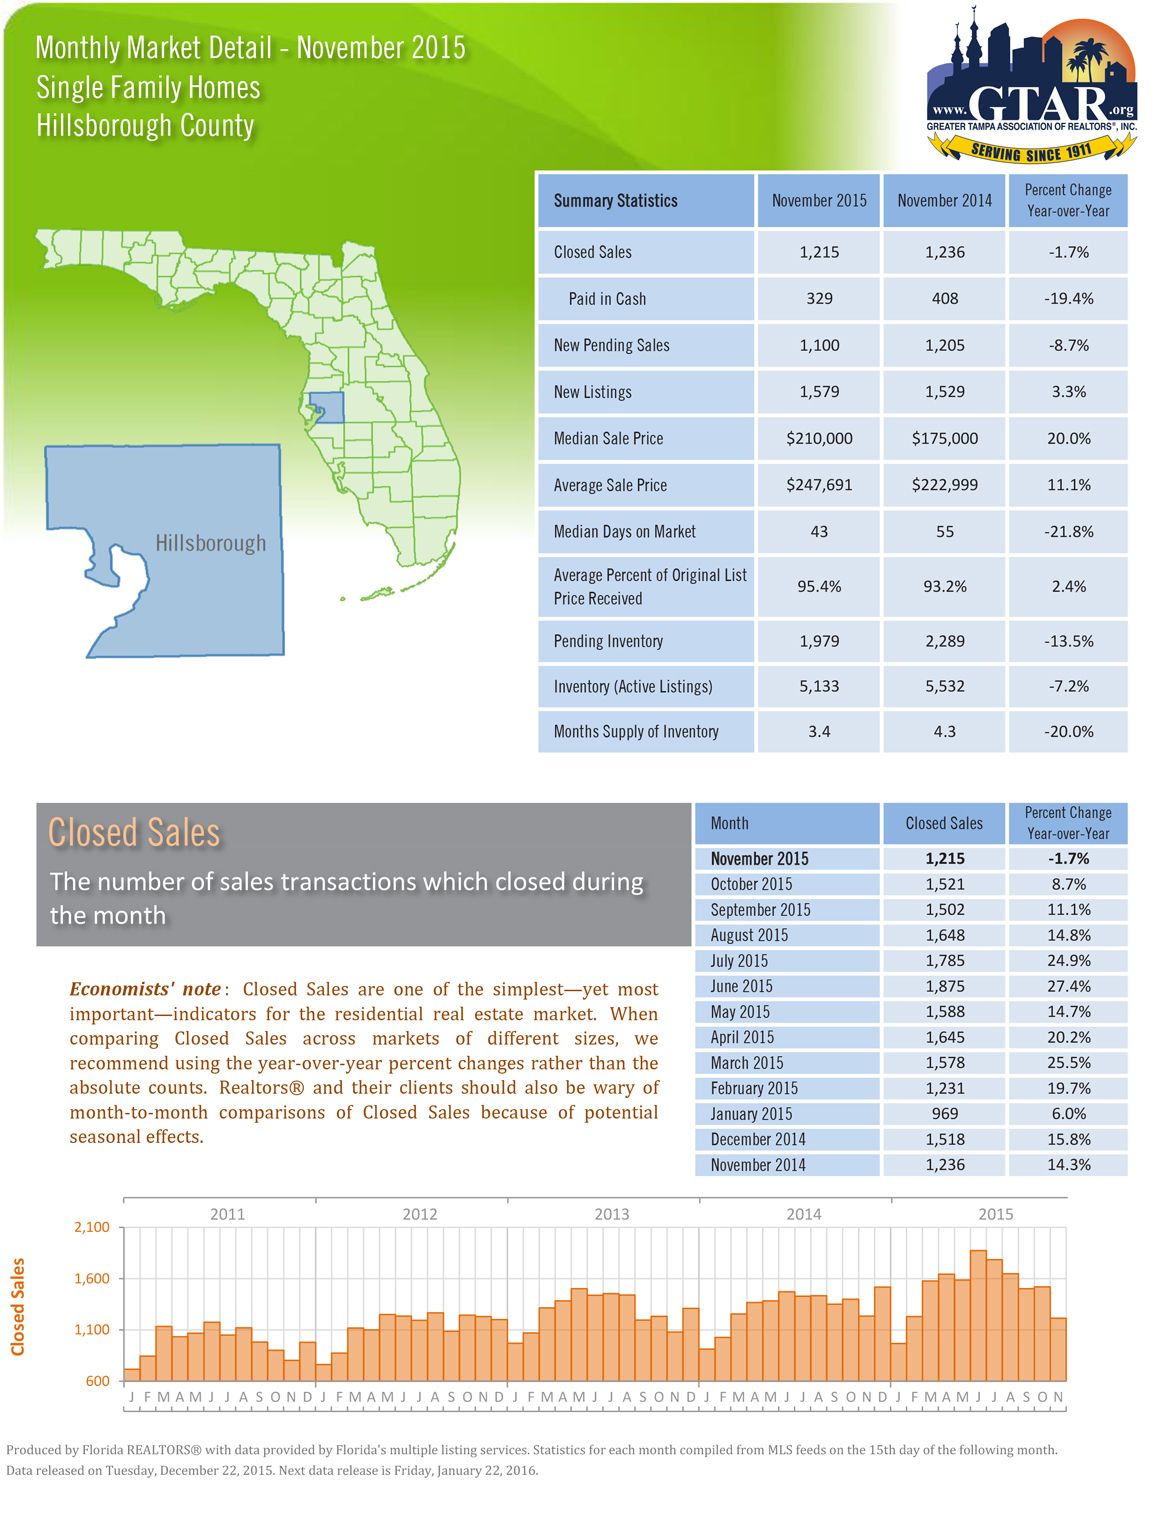
You may notice that the image states that these are the numbers from November...there's a lag in GTAR's reporting, so we're working with the most recent summary we have. We can always work up more up-to-the-minute numbers for you specifically!
THE GOOD:
Home values: Check out the difference from 2014 until now in both the average and the median selling prices! Wow! 11% and 20% increases respectively...that's huge! We've been enjoying modest to rapid price appreciation for several years now, and this is one of the highest year-over-year figure I've seen!
Days on Market: Another huge percentage change from last year until now. Homes are selling about 22% faster than a year ago. It now takes just a month and a half to sell a home, on average. Unless the market is heavily appreciating (like 20% or more per year), your chances for selling for the highest price continues to be in the first few weeks of listing your home for sale.
THE BAD:
Inventory levels: Well, this could be filed under "the good" depending which side of the market you're on (buyer or seller). The number of homes on the market is down over 7% from last year. The number of new listings hitting the market is roughly the same.
Month's supply: Again this could be good if you're selling, not so much if you're a buyer. Right now there's only 3.4 months' worth of supply out there. This means that it would only take three and a half months to sell everything that's currently for sale, given the current sale pace. Last year there was a full month's worth more for sale.
THE UGLY:
Pending sales: An indication of closings within the next few months is the number of new contracts, which is down 8.7% since last year. This means we could see a slower first quarter than 2015 in terms of home sales. It could be a market slowdown, and can also be a side product of the lack of homes to buy.
New Listings: Piggy backing on that is the number of newly available homes. Down 7.2% from last year, the already low inventory levels show no signs of breaking. Today's buyers have even less to choose from than in 2015.
Closed sales: We'll we've finally hit a month where the number of sales has declined since last year. In the last 12 months, the lowest year-over-year increase was 6%. Now we're talking about a loss. This is certainly a number to keep an eye on, as many economists anticipate a slowdown in the overall real estate market in 2016.
WHAT IT ALL MEANS:
As we wrapped up another huge year for home sales, the market continues its huge rise from the depths of the recession. Prices have come back to near 2004-2005 levels, after falling 40-60% in some areas of Tampa Bay. Inventory levels are a fourth of their 2010 levels, when short sales and foreclosures ran rampant. If you're a buyer, you undoubtedly feel the competitiveness of searching for homes. If you're a seller, you're likely having discussions with your agent of how to handle multiple offers and creating bidding wars.
Going into 2016, there are several important factors to consider that will affect the market:
- Interest rates. As the Fed continues to raise the rates, mortgage rates will most likely follow suit. It's important to know that a 1% spike in mortgage rates means you've just lost 10% of your purchasing power as a buyer. That's huge. If you're shopping for a $500,000 home at 4% and the rates go up to 5%, you'd better start looking at $450K listings.
- Election year. If there's ever a time when consumer confidence is at it's most volatile, it's the election years.
- The overall economy. As I write this, the Dow is down about 12% in the past six months. This is certainly something to watch when it comes from the confidence of the home buyer.